Bytesafe’s new feature update provides a Graph visualization that makes security management more accessible and transparent than ever before - regardless if you’re a developer or security professional.
With an intuitive display of relationships between registries, firewalls, and upstreams, along with a clear overview of important policies and plugins, managing your security configuration has never been easier. A great addition for any organization looking to prioritize their security management.
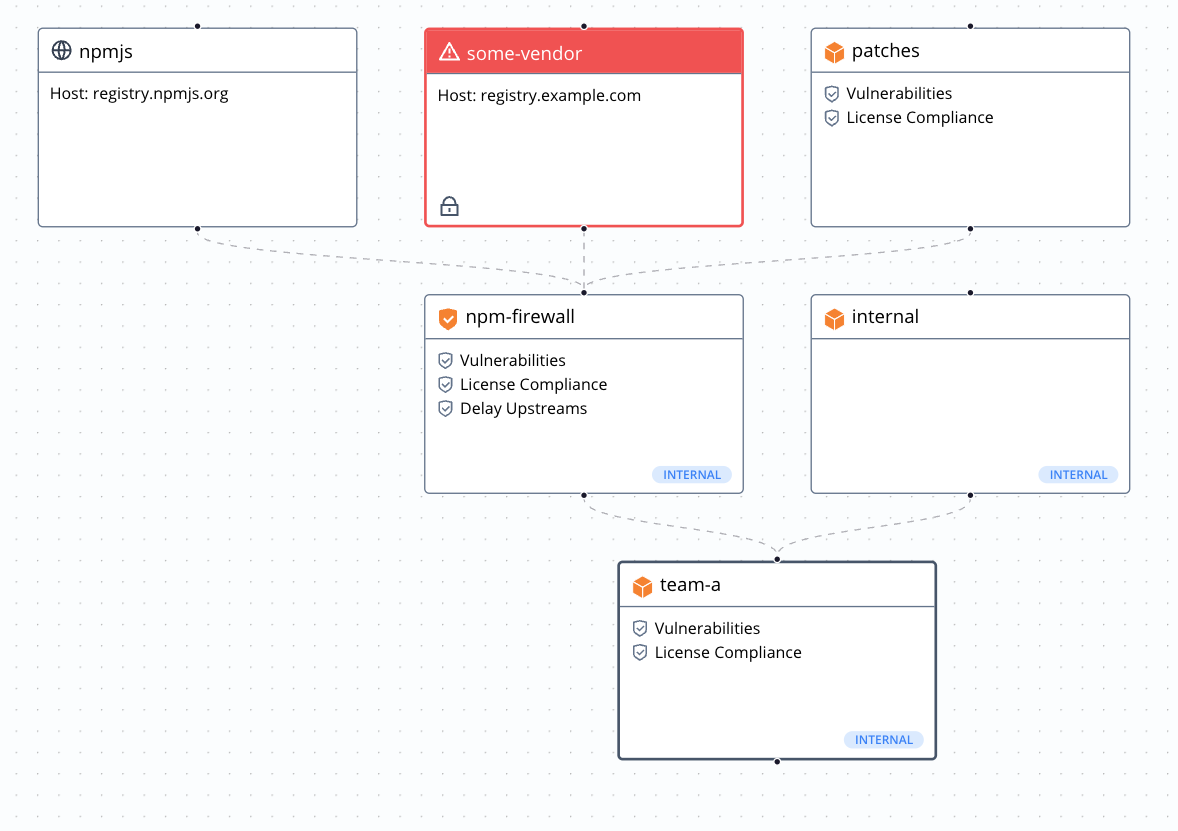 Our new Graph visualization is not just “eye candy”, it also provides an intuitive display of the relationships between your registries, firewalls, and upstreams such as npm, Nuget.org or pypi.org. Or even your repos in GitHub, Azure etc.
This tool also provides an overview of your current configuration, highlighting the most important policies and plugins that are enabled for each registry or firewall.
With multiple teams working on different applications, each with their own unique security requirements, it can be challenging to keep track of everything. Our Graph visualization makes it easier than ever to understand your security setup, so you can take responsibility and ensure that your applications are fully protected.
At Bytesafe, we believe that security should be accessible to everyone, and this addition is yet another step in that direction.
Try out our new Graph visualization and see how easy it is to manage your security configuration with Bytesafe.
Review your setup and security configuration
- Login to your workspace.
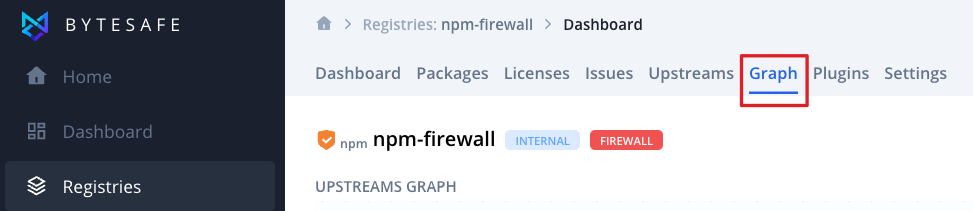
- Go to Registries > and click on a Firewall or Registry.
- Click on the Graph tab to see the relations and configuration.
Hope you like it!